Postgres EXPLAIN ANALYZE Visualizer
Paste the output of EXPLAIN or EXPLAIN (ANALYZE, BUFFERS) as text or JSON and see the plan as a tree, with the slowest nodes, row misestimates and index hints.
Runs in your browser. Nothing is uploaded.
How to read a PostgreSQL EXPLAIN ANALYZE plan
To get a plan, put EXPLAIN in front of your query in psql: EXPLAIN (ANALYZE, BUFFERS) SELECT ...; Copy everything psql prints, including the Planning Time and Execution Time lines, and paste it above. Add FORMAT JSON inside the parentheses if you prefer JSON; both formats work here.
ANALYZE really executes the statement. For an INSERT, UPDATE or DELETE, measure it inside a transaction and roll it back: BEGIN; then your EXPLAIN (ANALYZE, BUFFERS) statement, then ROLLBACK;
Reading the tree
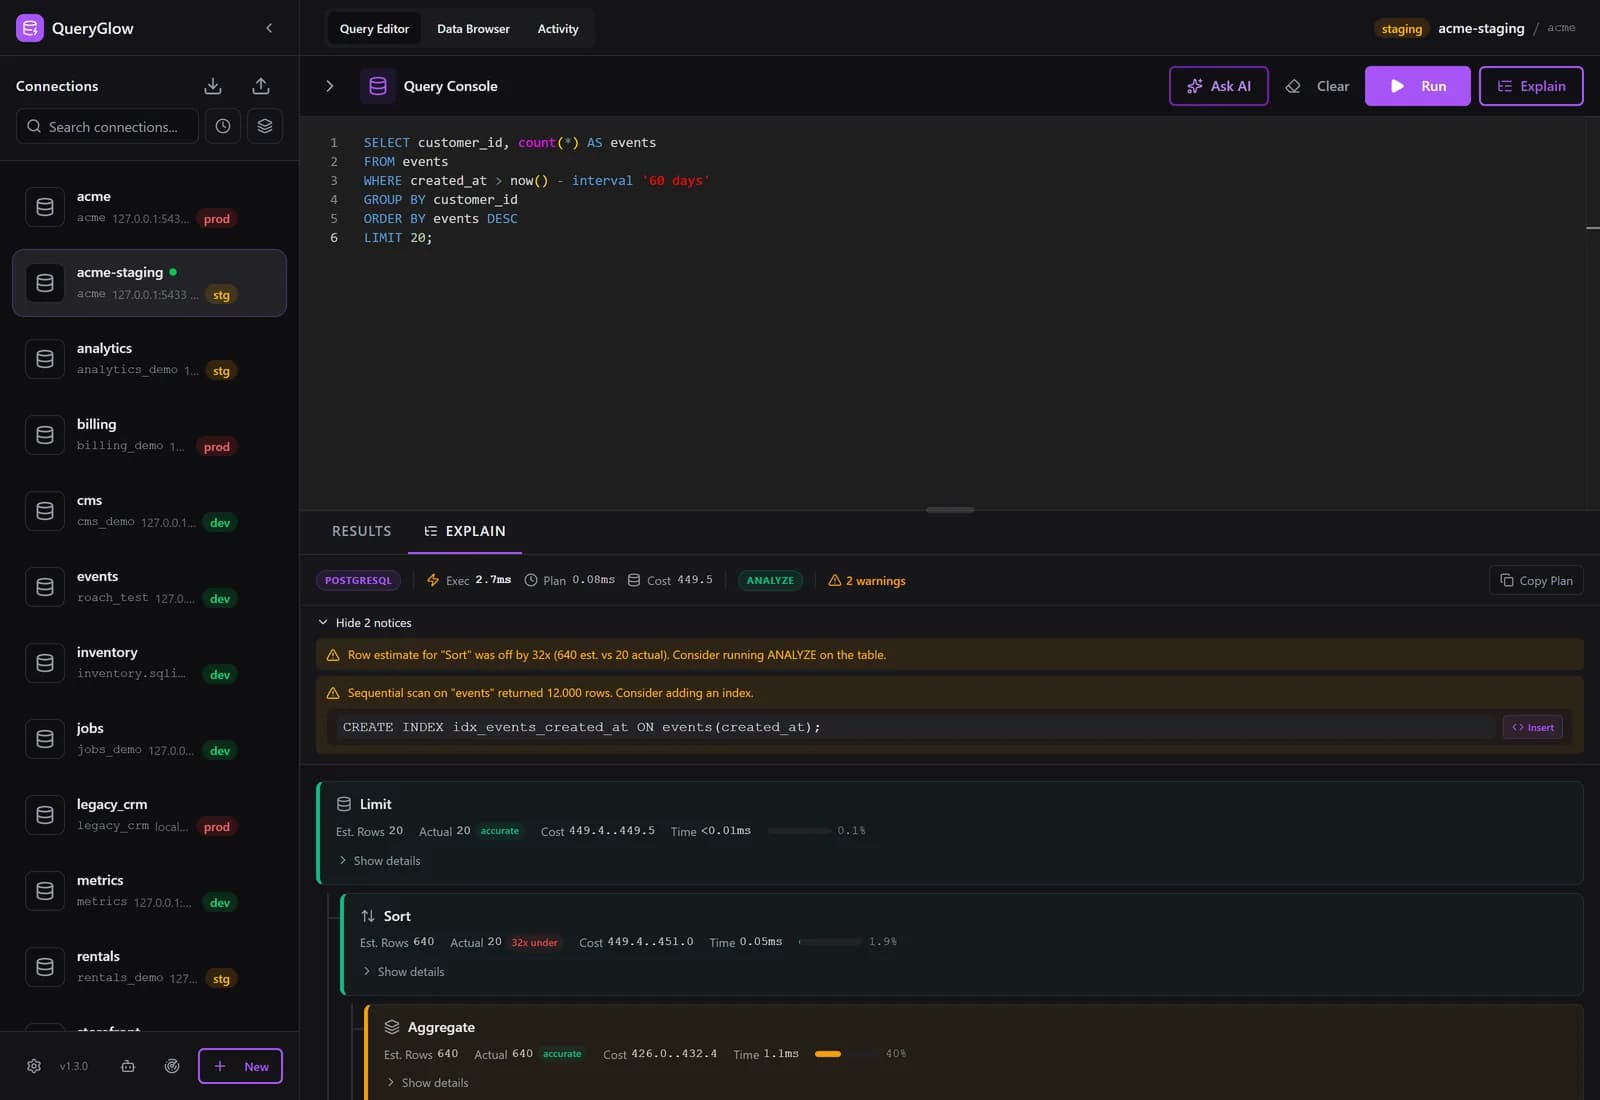
Each line that starts with an arrow (->) is a child node that feeds its rows to the node above it. The top node returns the final result. The actual time on a node is per loop and includes the time spent in its children, so multiply it by loops to get the total. Exclusive time is what the node itself spent after subtracting its children; the bars in the tree show that share of the execution time.
Estimated vs actual rows
The rows value in the cost part is the planner's estimate, the rows value in the actual part is what really came back. When the two differ by ten times or more, the planner picked its plan based on wrong numbers. That usually points to stale or missing statistics; running ANALYZE on the table refreshes them.
Common nodes
- Seq Scan: reads every row of the table and applies the filter.
- Index Scan: walks an index and fetches the matching rows from the table.
- Bitmap Heap Scan: collects matching row locations from one or more indexes first, then reads the table pages in order.
- Hash Join: builds a hash table from one input, then probes it with every row of the other.
- Nested Loop: runs the inner side once for every row of the outer side; fast for a few rows, slow for many.
- Sort: orders rows; external merge in the Sort Method line means it ran out of work_mem and used disk.
Buffers
With BUFFERS, each node shows shared hit, the pages found in the PostgreSQL cache, and read, the pages that had to come from the operating system or disk. A high read count on a node that runs often is a good place to start.
EXPLAIN on every query, one keystroke away
In QueryGlow the query editor shows this plan view for the query you are working on. It flags large sequential scans and suggests a CREATE INDEX after checking whether a matching index already exists, for PostgreSQL and the MySQL family. Try it on the demo database, then use it on your own servers for $79 once.
Stripe checkout. You'll enter your GitHub username for the repo invite. No refunds, so try the read-only demo first.
FAQ
Does EXPLAIN ANALYZE run the query?
Yes. EXPLAIN ANALYZE executes the statement to measure it, so an UPDATE or DELETE really changes data. Wrap it in BEGIN; and ROLLBACK; to measure a write without keeping the change.
Should I paste text or JSON?
Either works. The default text output from psql is fine; FORMAT JSON is exact to parse. Add BUFFERS to see how many pages came from cache and how many were read.
Why is my Seq Scan slow?
A sequential scan reads the whole table. If its filter throws away most rows, an index on the filtered column usually helps. If it returns most of the table, the scan is often already the fastest plan.